Home
Solutions
Resources
Blog
Podcast
FAQ
Strategy Session
VizualHub Login
Close
Contacts
Our Location
Austin Texas
Get in touch
Home
Solutions
Resources
Blog
Podcast
FAQ
Strategy Session
VizualHub Login
Home
Solutions
Resources
Blog
Podcast
FAQ
Strategy Session
VizualHub Login
Portfolio
Home
Portfolio
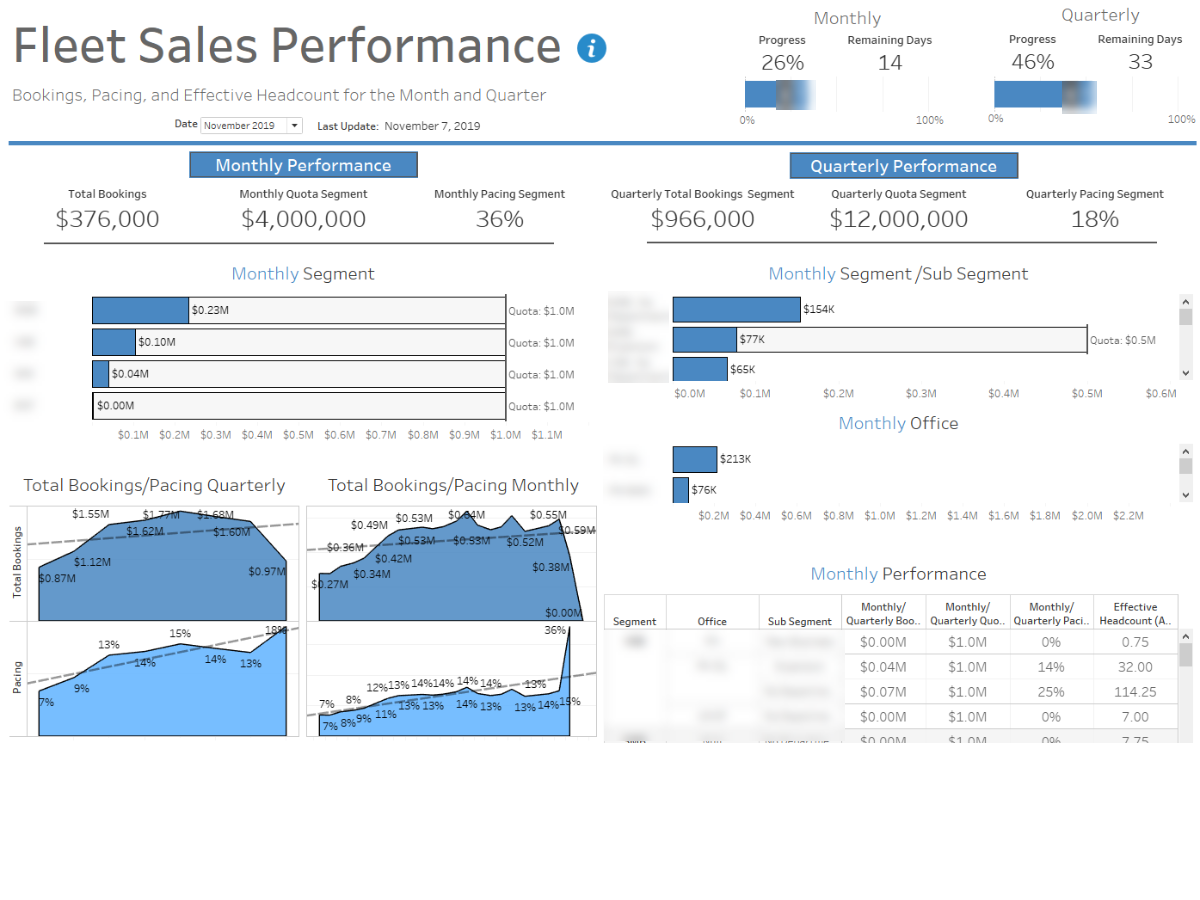
Sales Performance
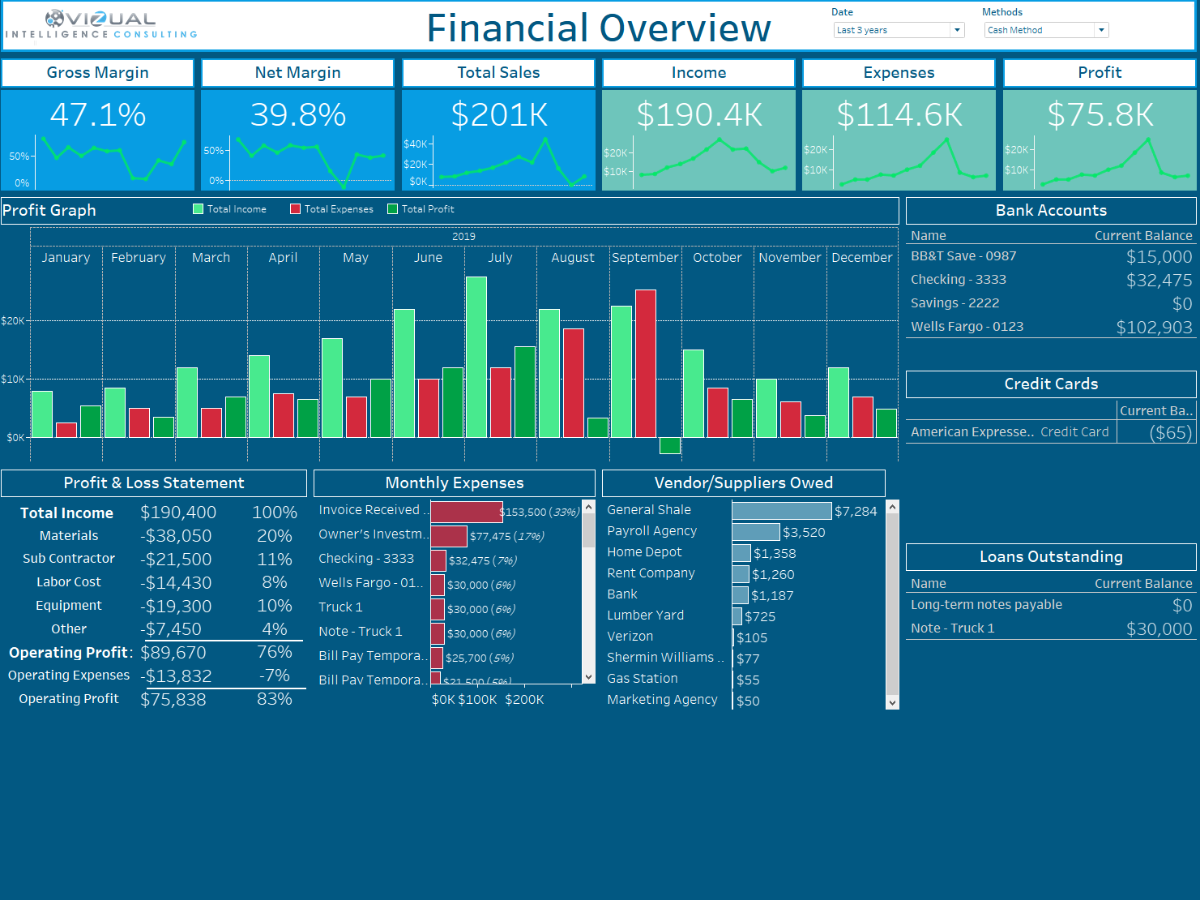
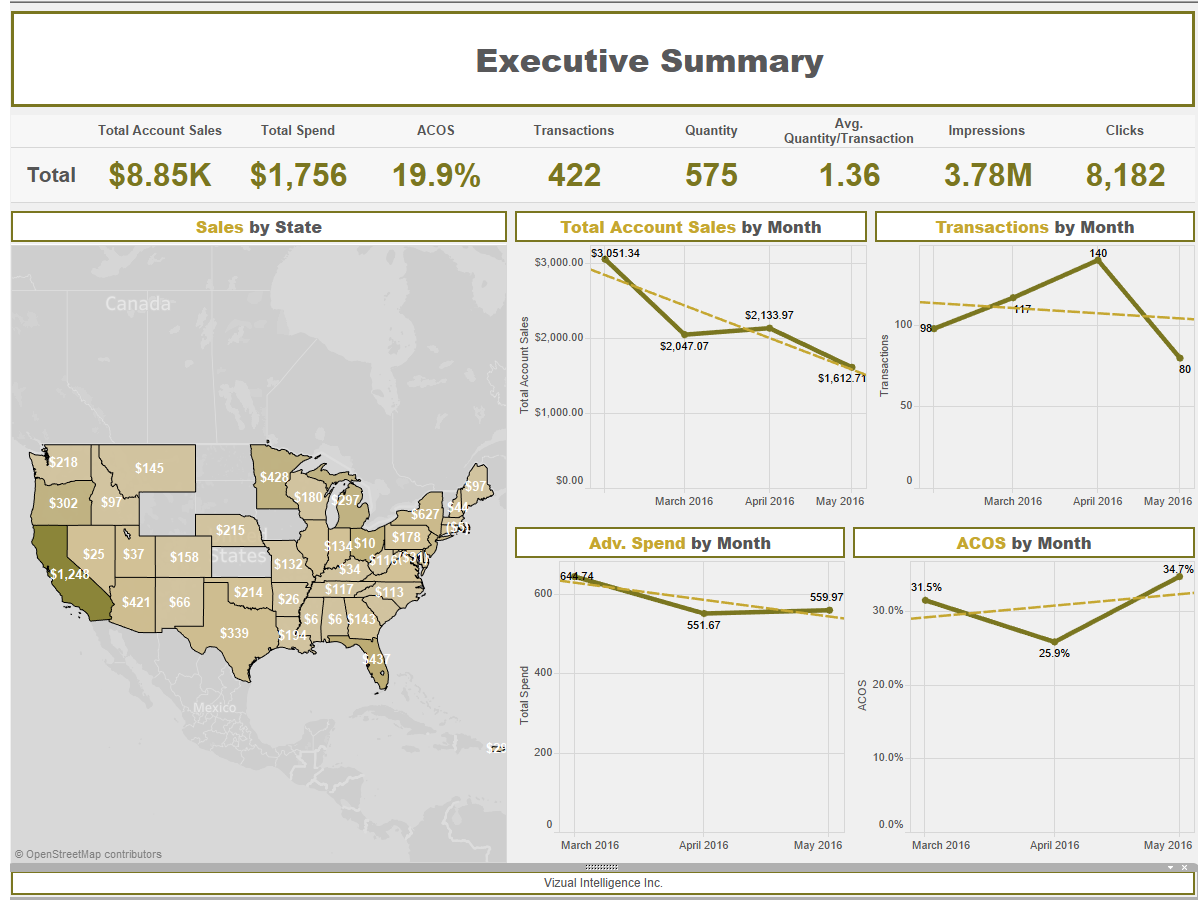
Financial Executive Summary
Client Reporting Executive Summary
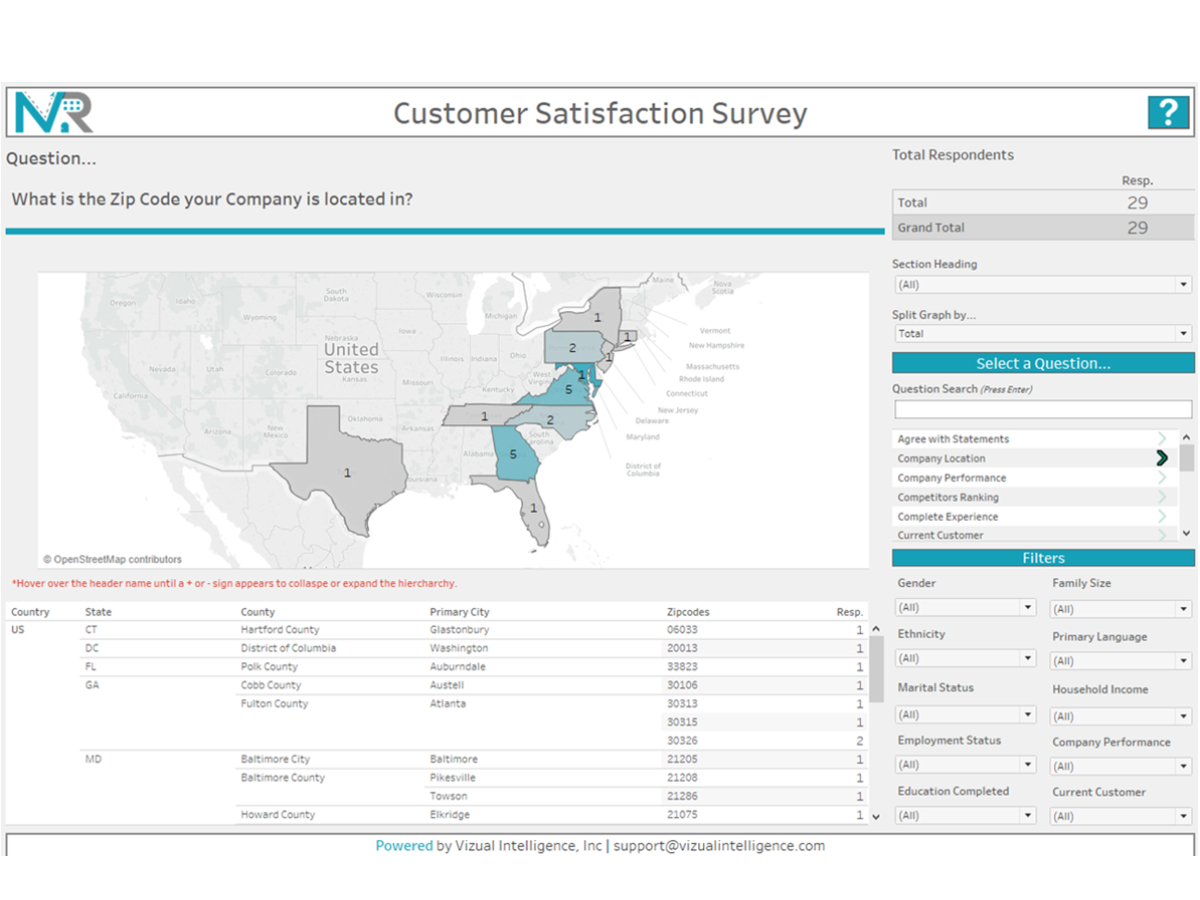
Customer Satisfaction Survey Dashboard
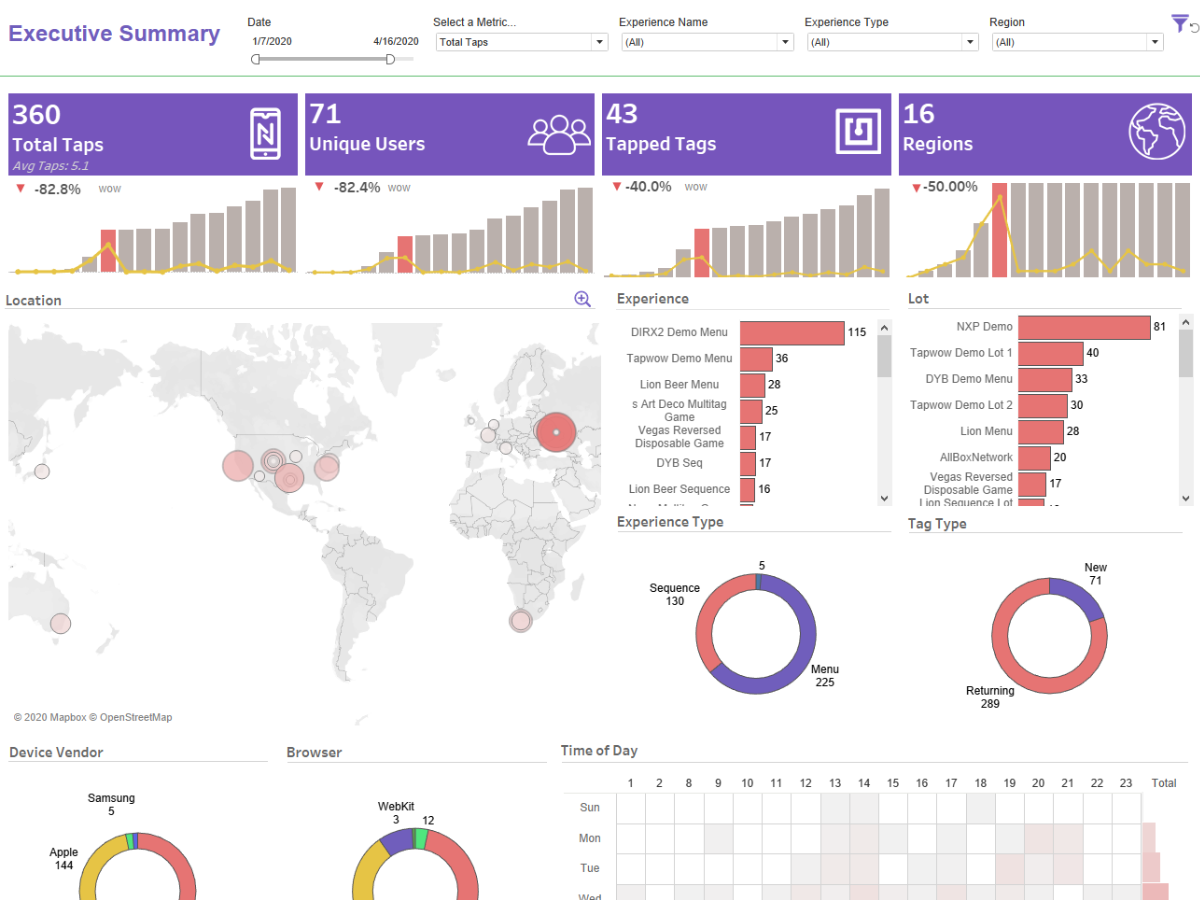
Transaction Executive Summary
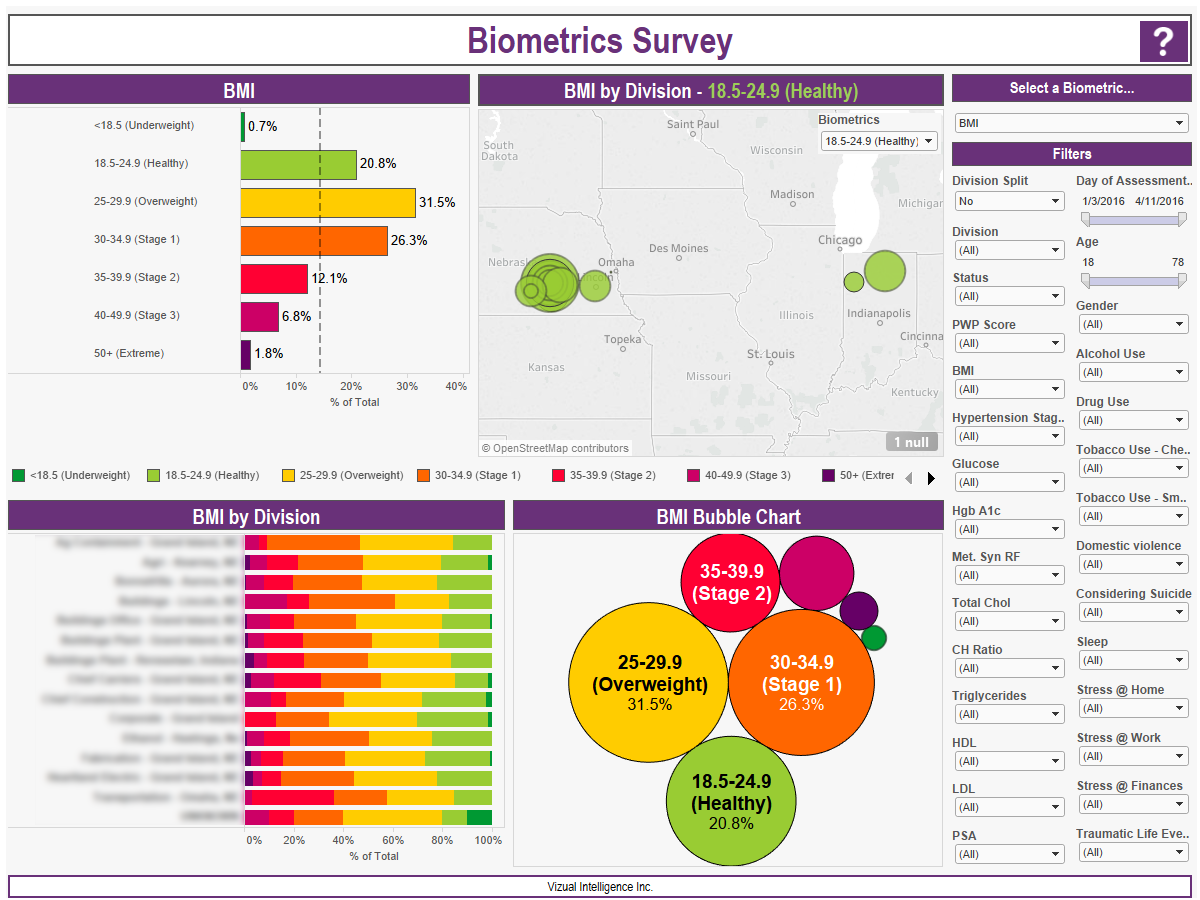
Biometrics Survey Dashboard
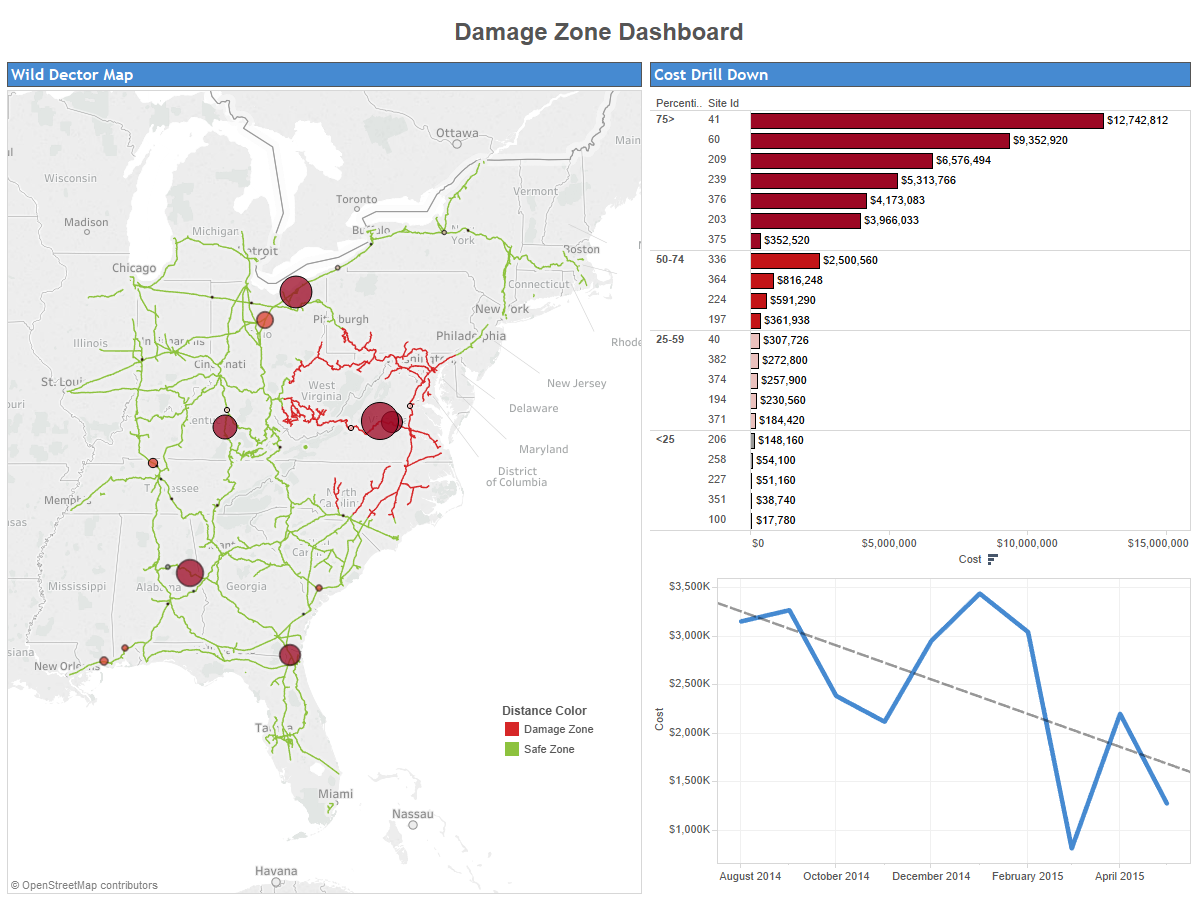
Railroad Damage Zone Dashboard
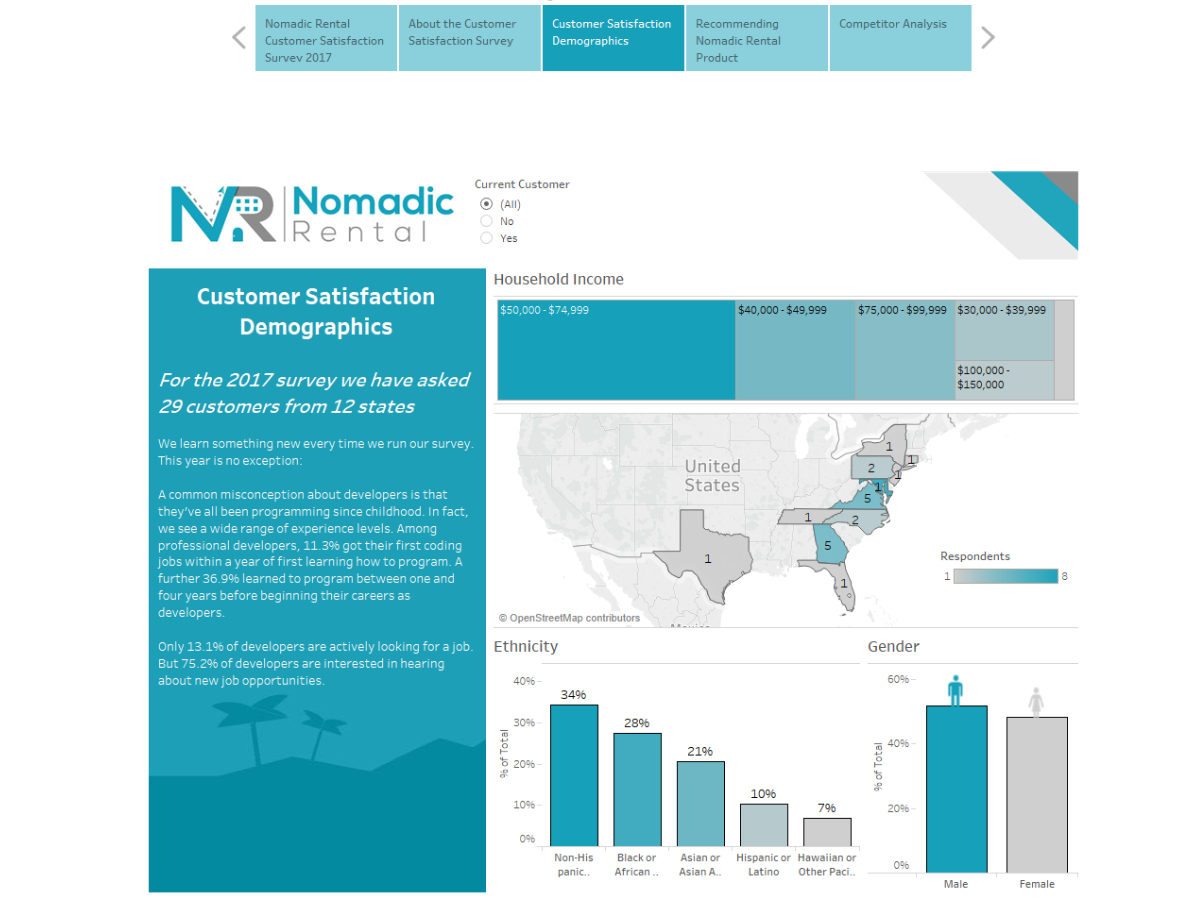
Customer Satisfaction Survey Presentation
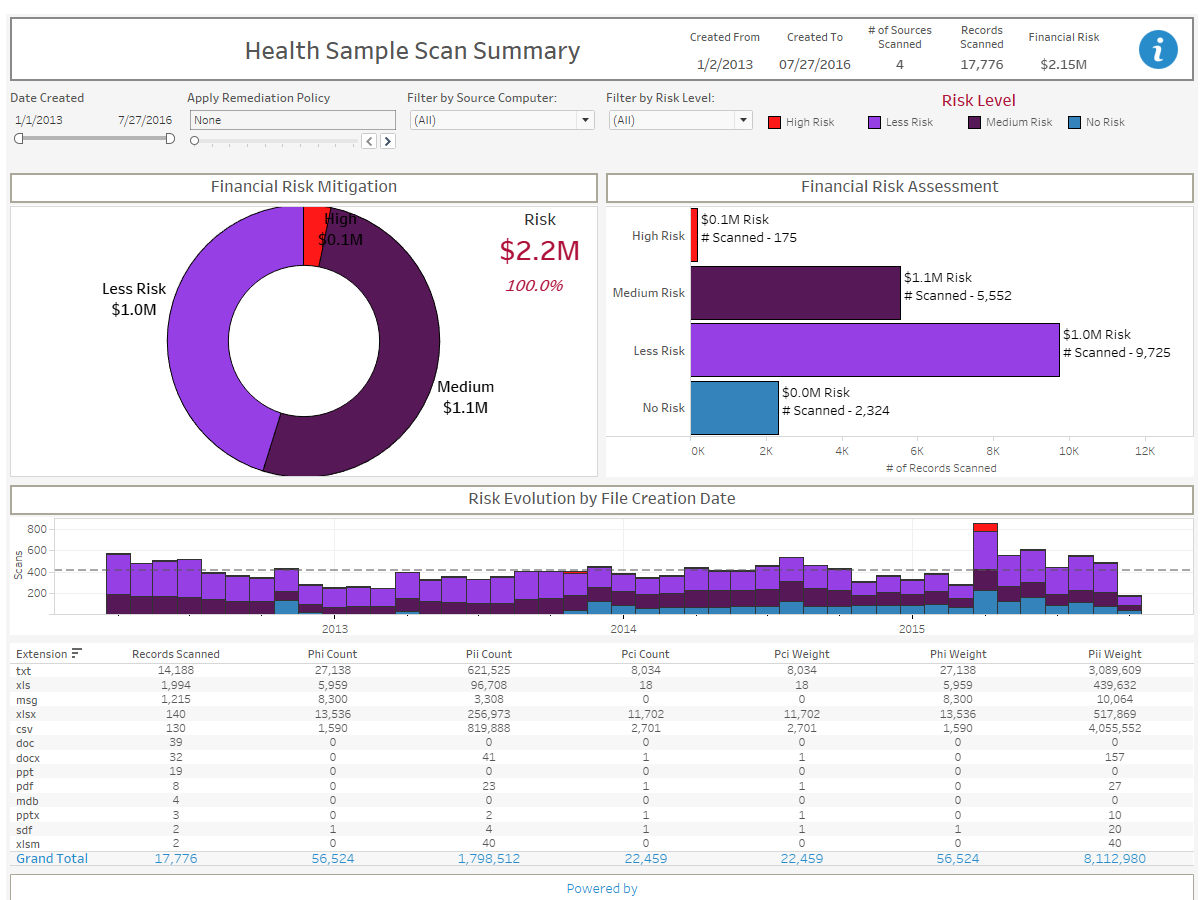
Computer Health Scan Summary
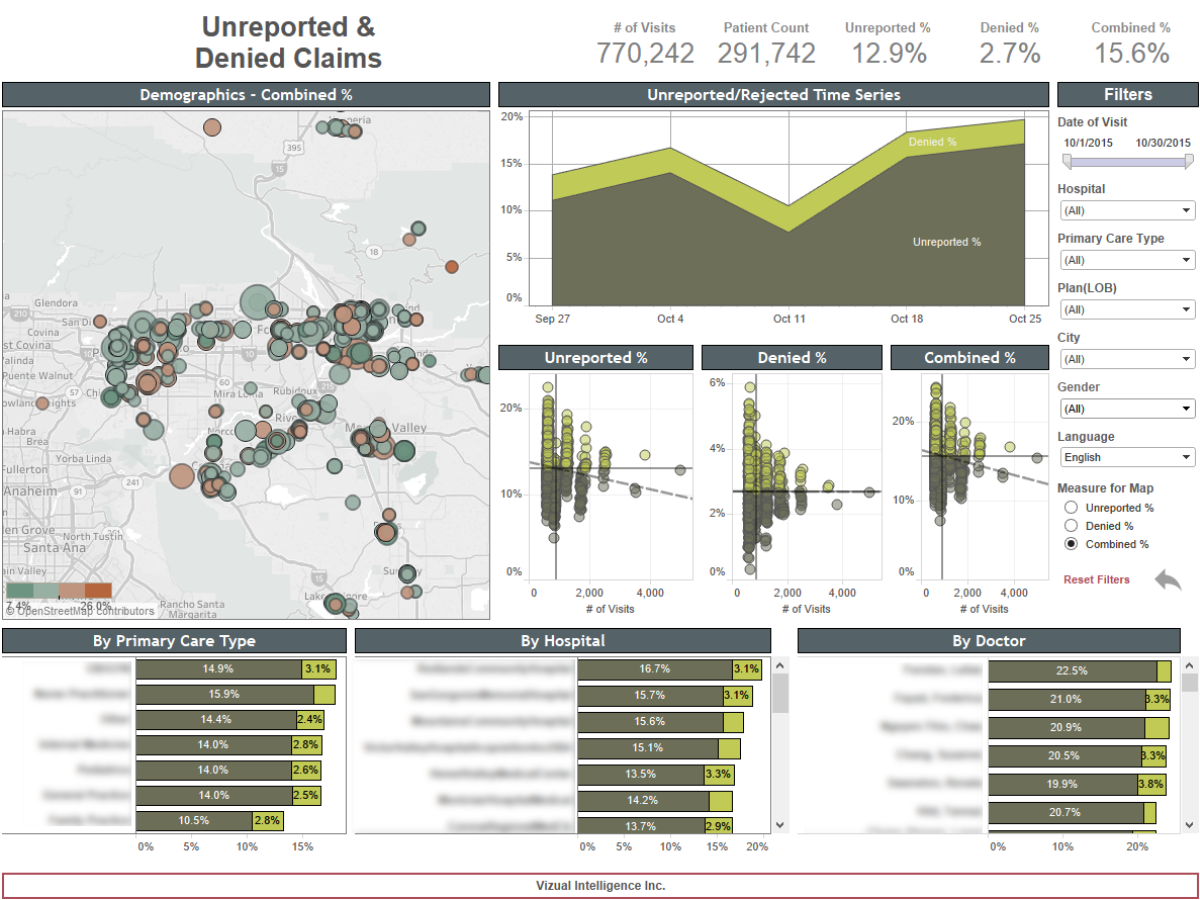
Healthcare Unreported & Denied Claims
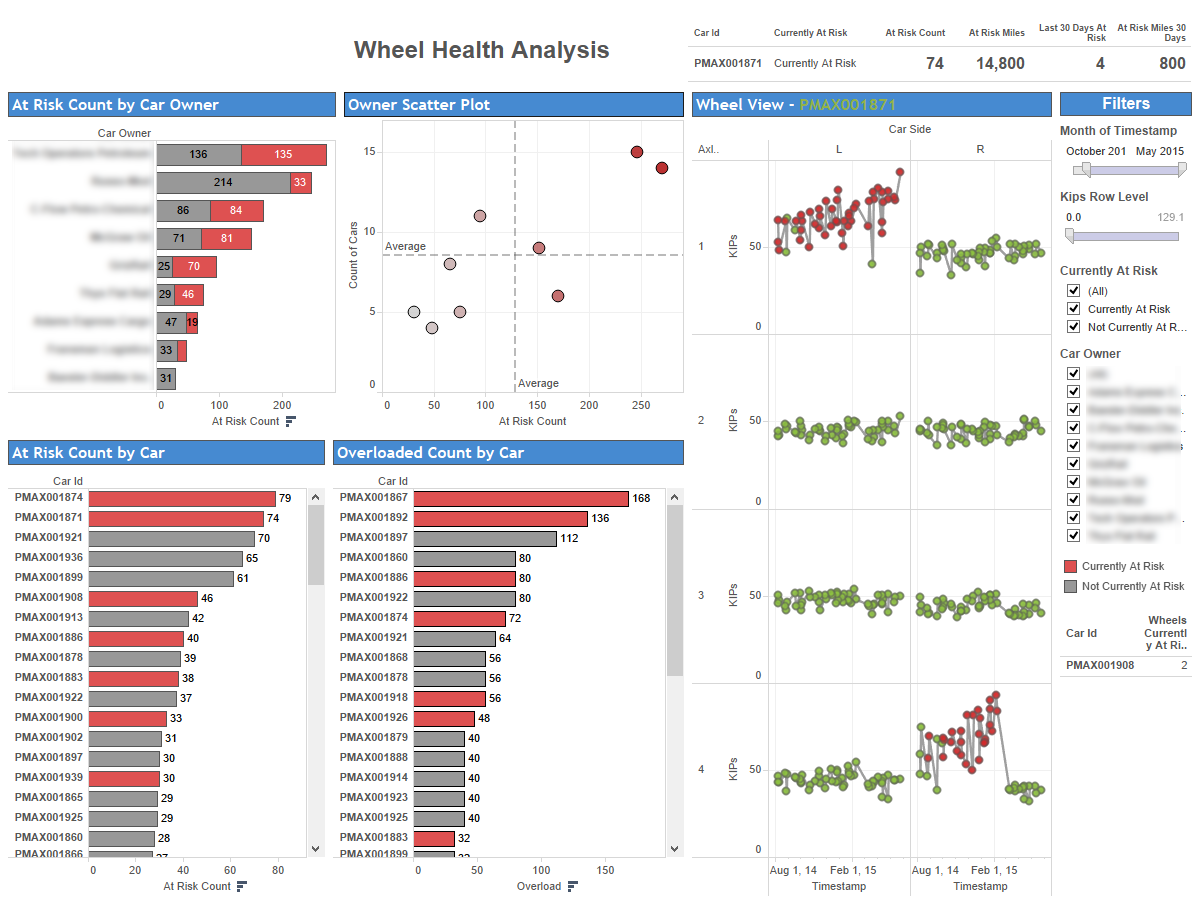
Locomotive Wheel Analysis
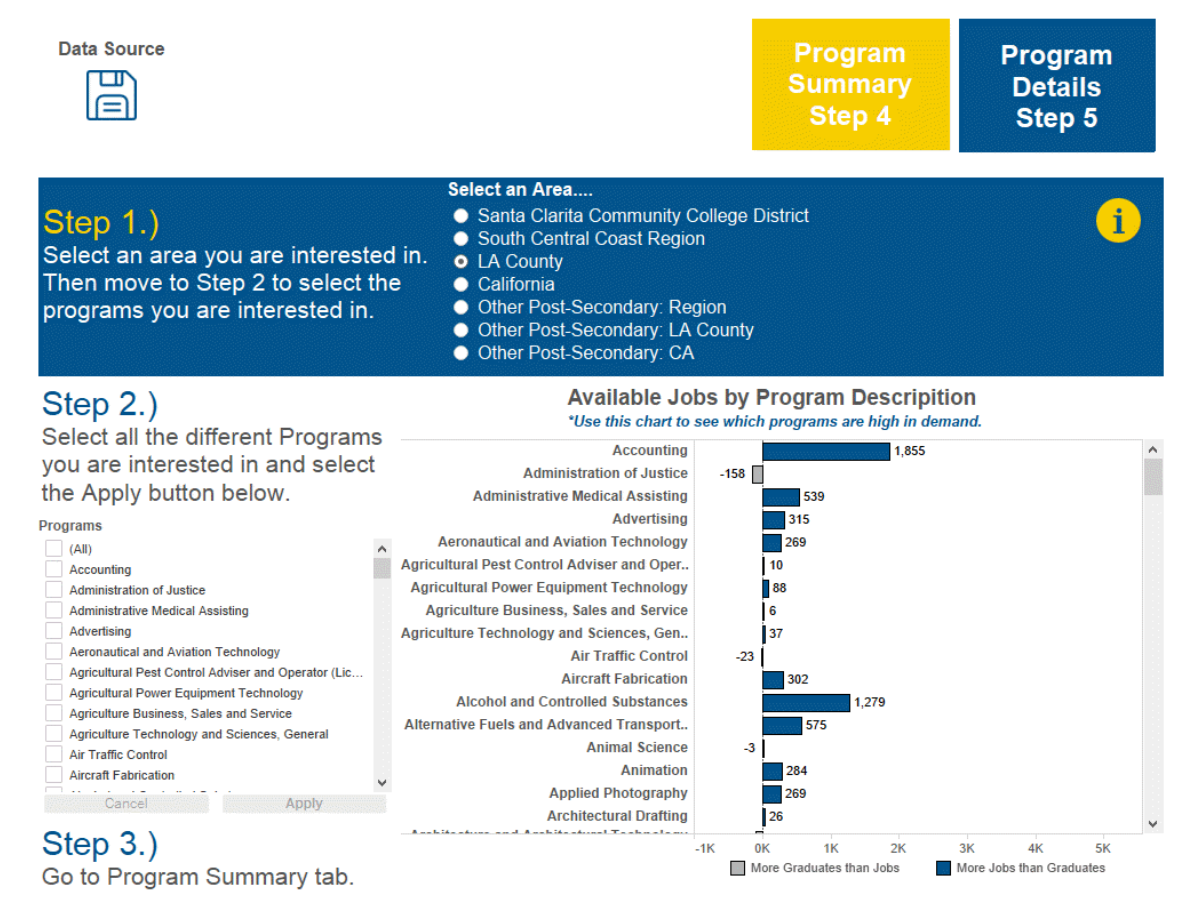
College Labor Market Tool
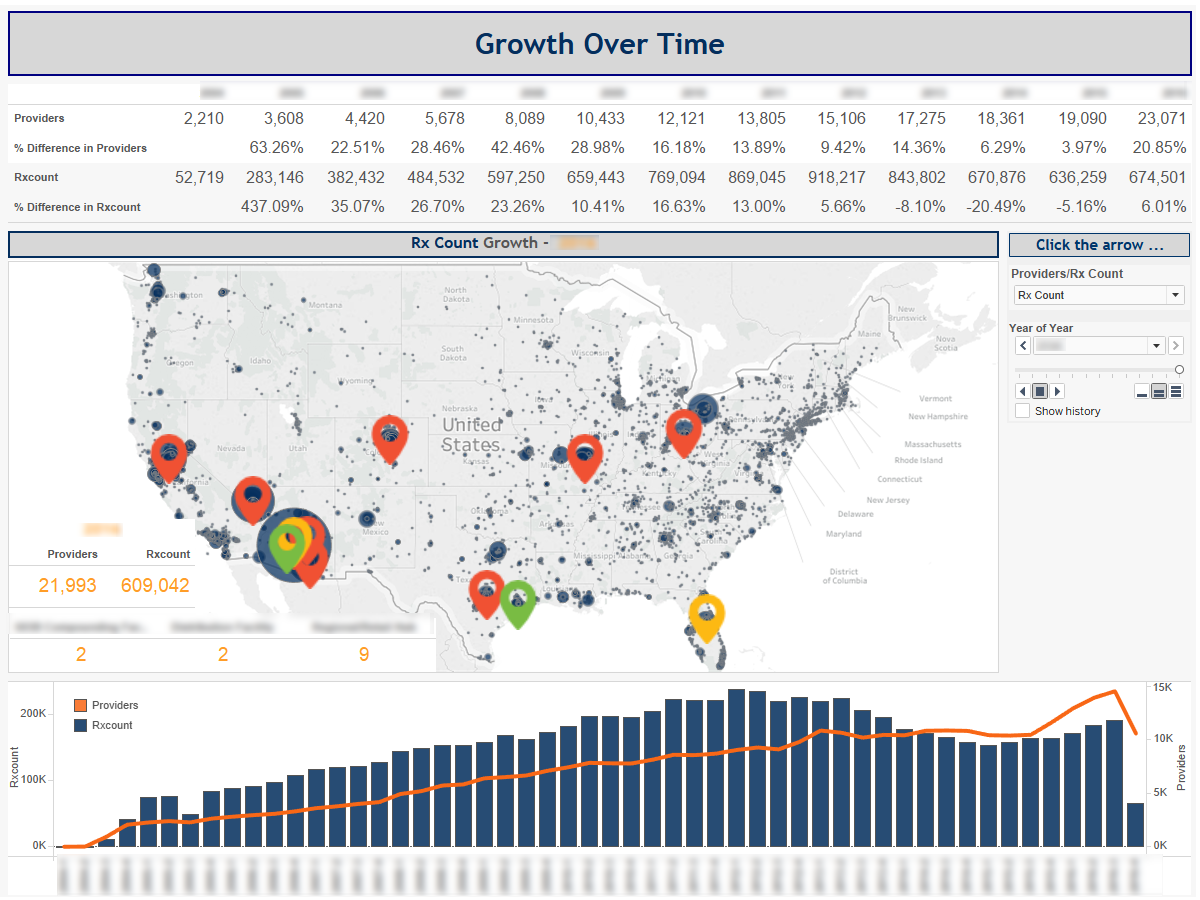
Provider Growth Dashboard
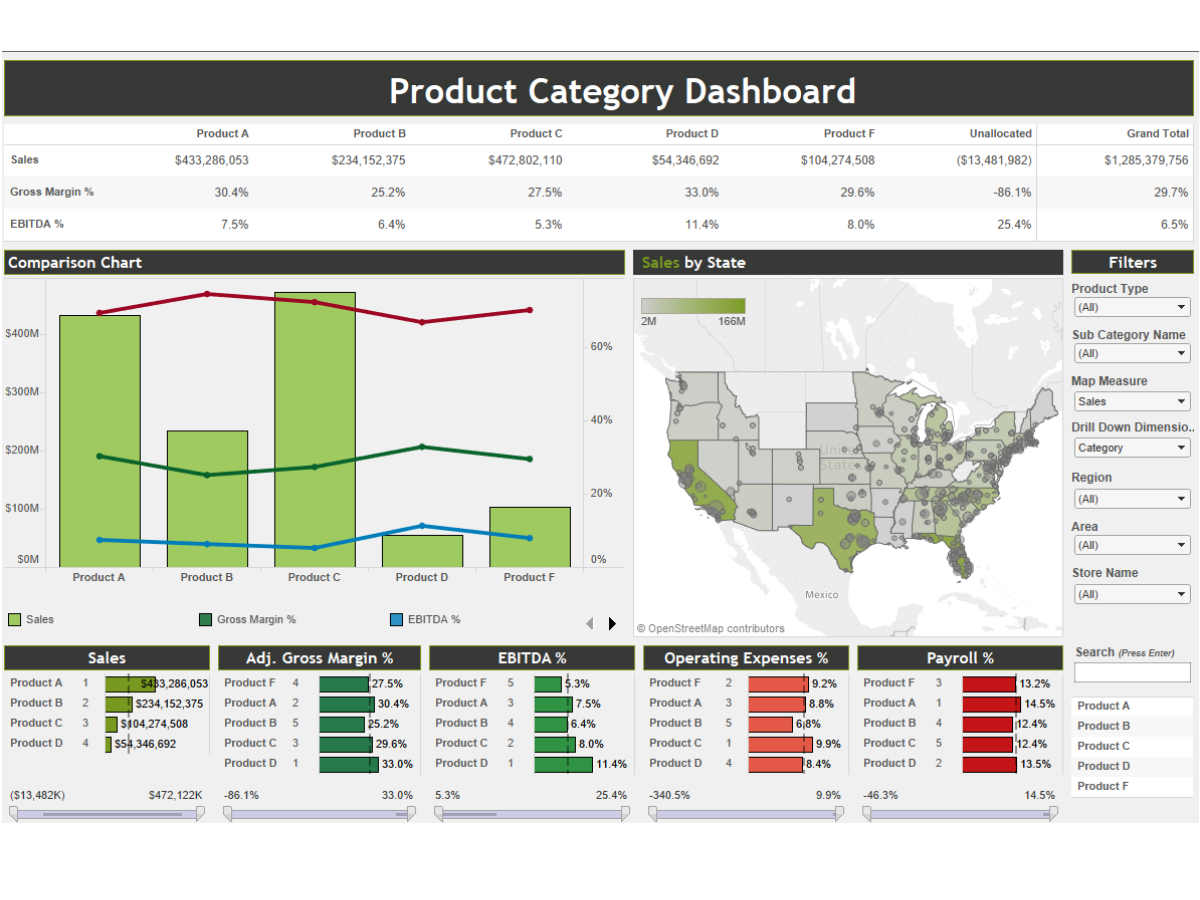
Product Category Finance Dashboard
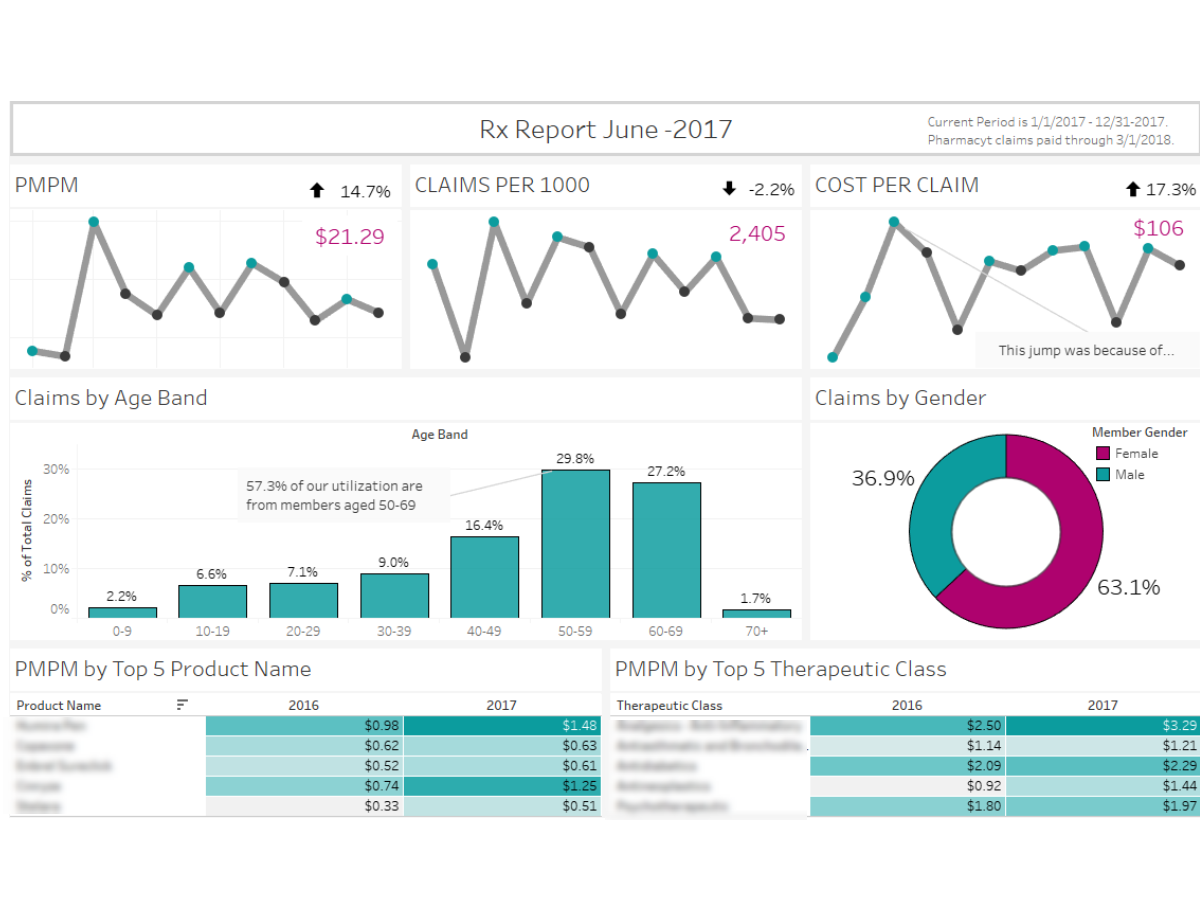
Healthcare Rx Report
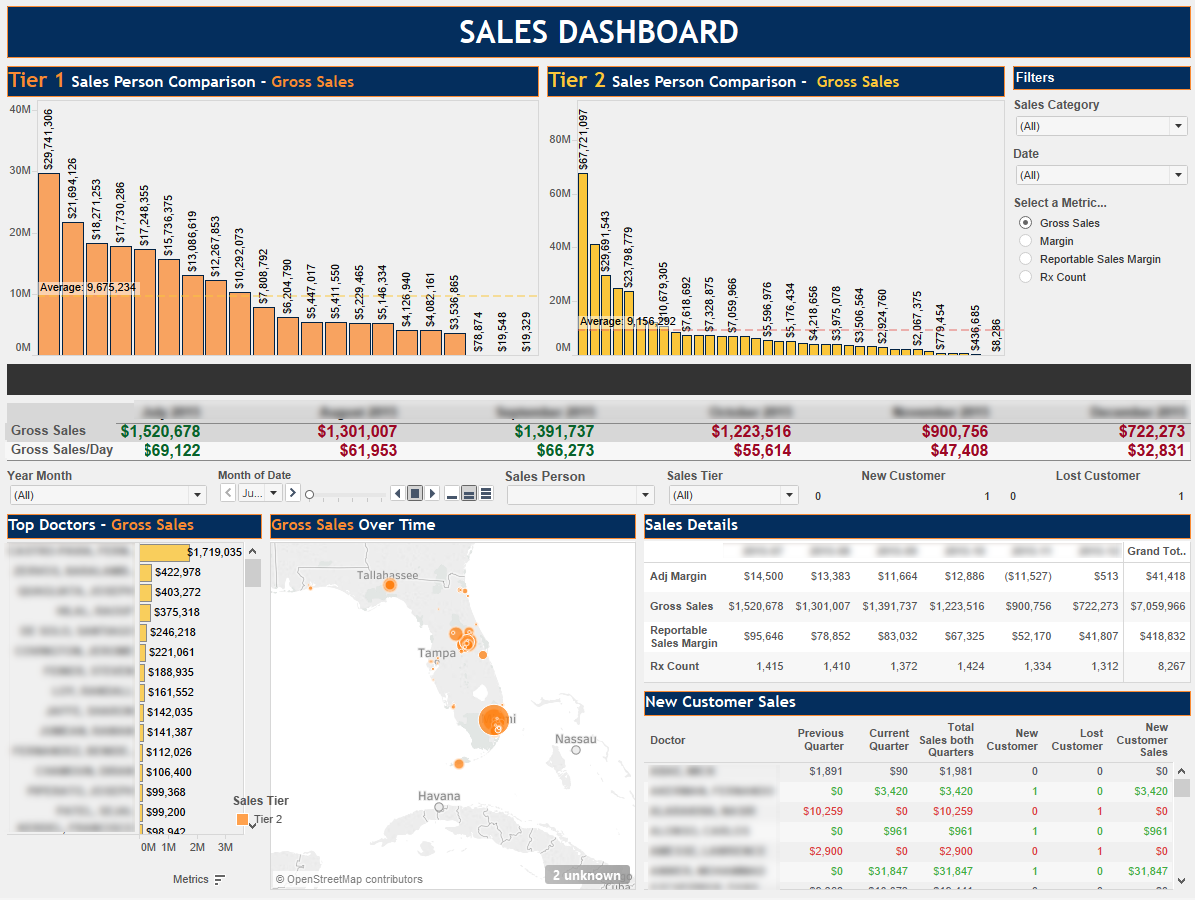
Sales Dashboard
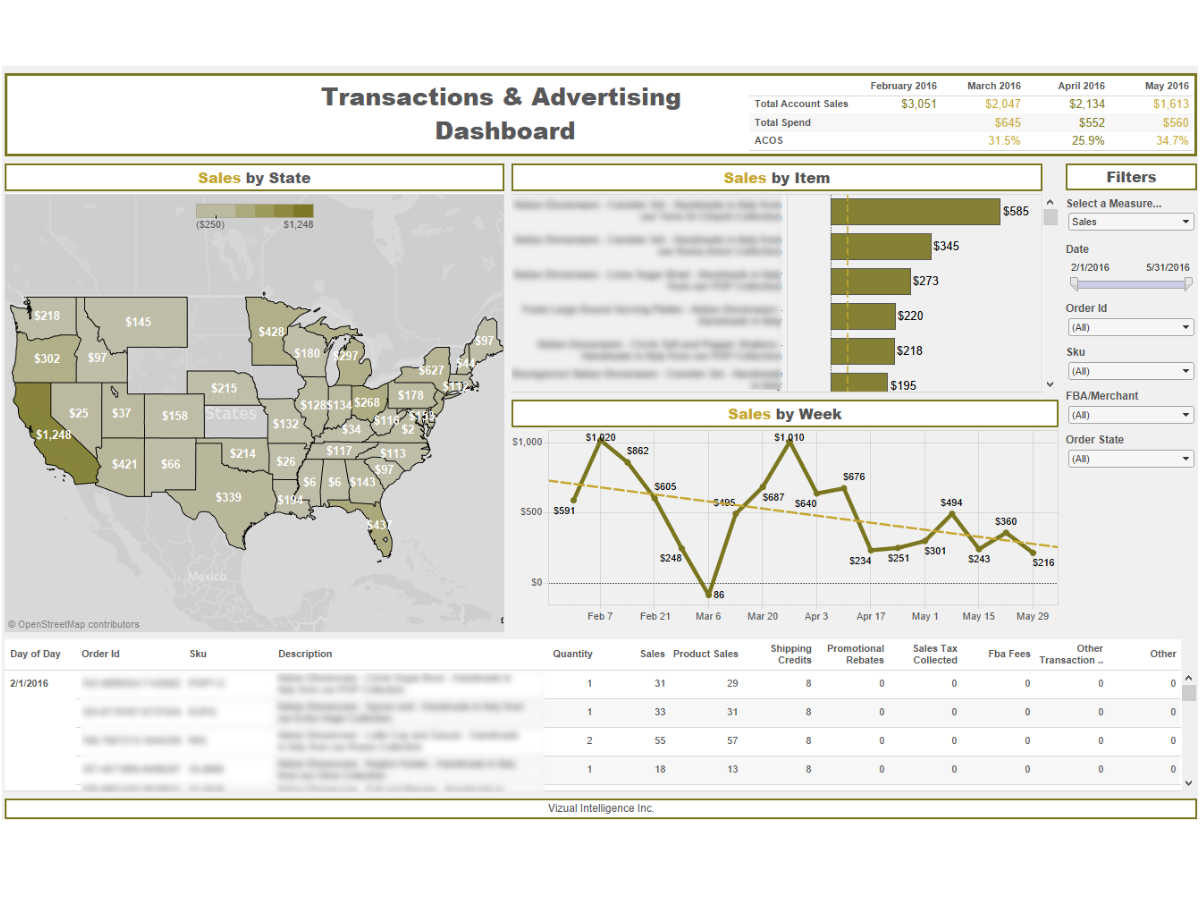
Transaction & Advertising Dashboard
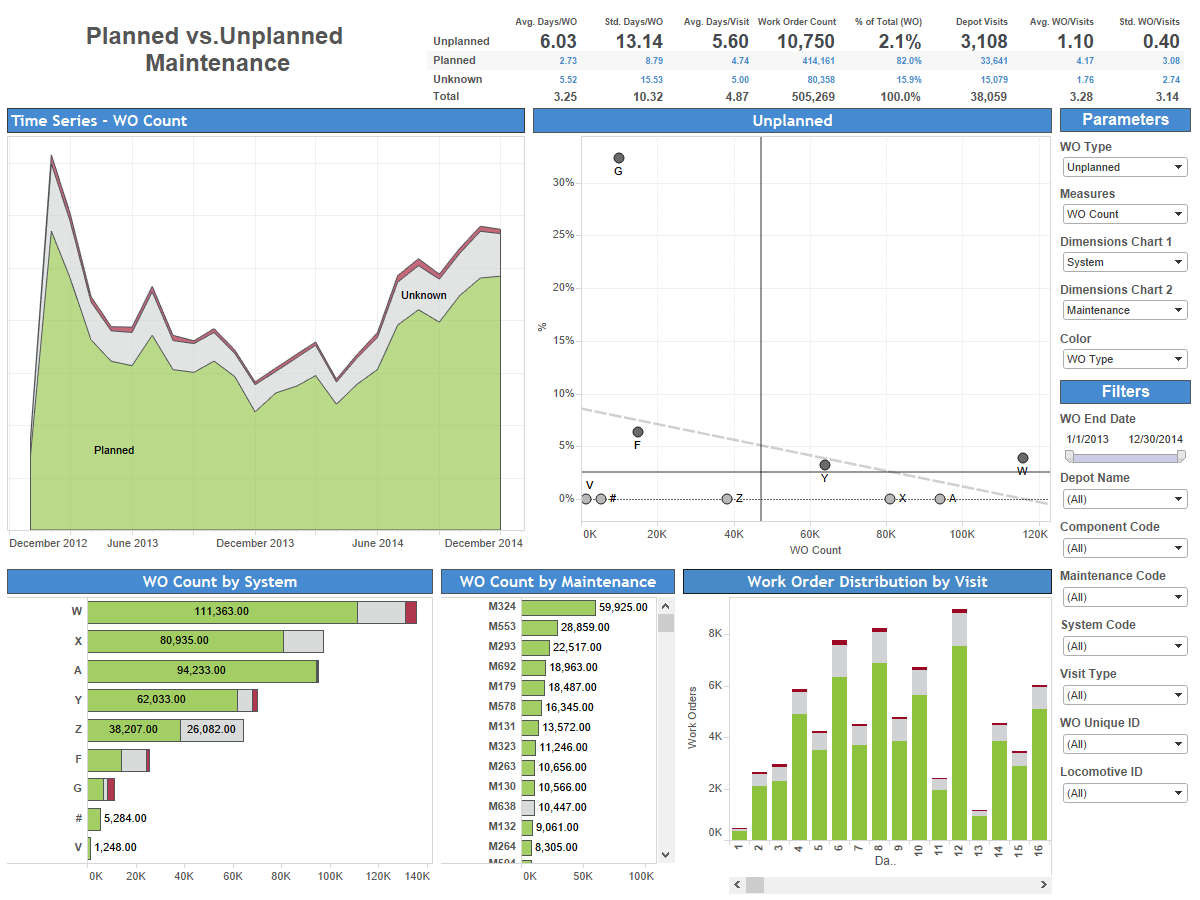
Planned vs. Unplanned Maintenance
get in touch
Don't be a don'ter, Do be a doer
Johnny Wu – Pain & Gain
Our Location
Social network
Austin, Texas
Link
Instagram
Youtube
Linkedin-in
Get in Touch
Please enable JavaScript in your browser to complete this form.
Please enable JavaScript in your browser to complete this form.
Full Name
*
Email
*
Subject
*
Message
Send a Message
Innovation Doesn’t Wait for Anyone.